How to Read a Mobile Crane Load Chart
A step-by-step guide to reading a mobile crane load chart: radius, boom length, deductions, configuration and the common mistakes that overload cranes.
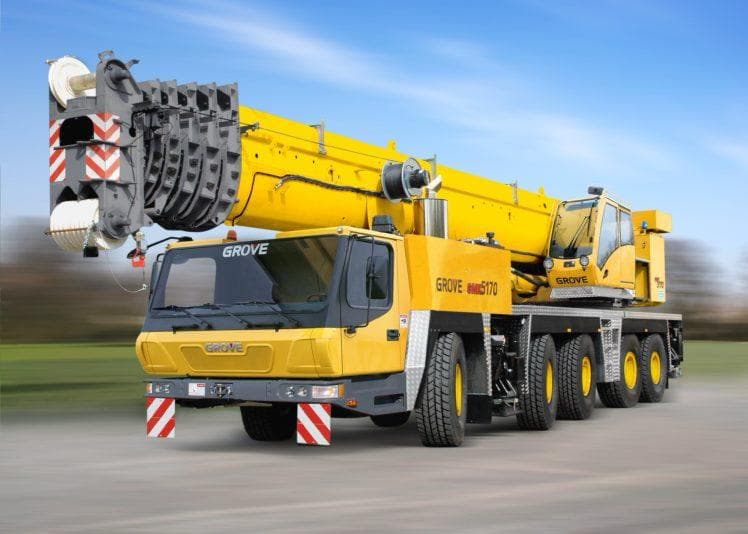
A load chart is the table that tells a crane operator how much the crane can lift in a given configuration. It is the single most important document on a lift, and it is also where most planning errors start. You do not need to be an operator to understand one. Knowing how to read a mobile crane load chart lets you check a supplier's recommendation, spot an undersized crane before it arrives, and ask the right questions in a lift plan review.
What a Load Chart Shows
Most charts are a grid. Down the side is the radius: the horizontal distance from the crane's centre of rotation to the load. Across the top is the boom length. Each cell shows the maximum load, in tonnes, the crane can lift at that radius with that boom length. A blank cell means the combination is not possible, usually because a long boom cannot be lowered far enough to reach a short radius, or a short boom cannot reach that far out.
Every chart applies to one configuration, stated in its heading: outriggers fully extended or partly extended, the counterweight fitted, and the working area, such as 360 degrees or over the rear only. A crane can have many charts. Reading the wrong one is a classic mistake.
An Example Chart
| Radius (m) | 11 m boom | 20 m boom | 29 m boom | 38 m boom |
|---|---|---|---|---|
| 3 | 50.0 | n/a | n/a | n/a |
| 5 | 36.0 | 30.0 | n/a | n/a |
| 8 | 22.5 | 21.0 | 17.5 | n/a |
| 12 | n/a | 13.0 | 12.0 | 10.0 |
| 16 | n/a | 8.5 | 8.0 | 7.2 |
| 20 | n/a | n/a | 5.8 | 5.4 |
| 26 | n/a | n/a | 3.6 | 3.4 |
The headline 50 tonnes appears in one cell only. At 20 metres the same crane manages under 6 tonnes, and at 26 metres under 4. That drop is normal for every mobile crane and is the reason the crane's name is a poor guide to what it can do on your site.
Reading the Chart Step by Step
Step 1: Work Out the Total Load
Add the item's weight, the hook block, slings, shackles and any spreader beam. Many charts also require you to deduct stowed or rigged attachments such as a fly jib. Check the chart's notes, which list the deductions for that crane. Suppose the item weighs 4.0 tonnes and the hook block and rigging add 0.5 tonnes: the total is 4.5 tonnes.
Step 2: Find the Radius, Then Round Up
Measure the largest radius in the lift, at pick-up or set-down. If it falls between two rows, use the larger radius, never the smaller one, and never average between rows. A lift at 18 metres in the example chart is read on the 20 metre row.
Step 3: Pick a Boom Length That Clears the Height
Choose the boom length that gives enough height to clear the highest obstruction with the rigging below the hook. If you need more than 20 metres of boom at 20 metres of radius, you are in the 29 metre column, which shows 5.8 tonnes.
Step 4: Compare and Apply a Margin
4.5 tonnes against a chart value of 5.8 tonnes is about 78 percent of capacity. That is inside the chart, but your site's HSE rules may class a lift above a set percentage of chart capacity as a critical lift, with extra planning and approval. Our lift plan checklist covers what that involves.
Structural Limits and Stability Limits
Many charts shade some cells or separate them with a bold line. On one side, capacity is limited by the strength of the boom and structure. On the other, it is limited by stability, meaning the crane would start to tip before anything broke. Neither limit gives any warning margin to rely on. A crane overloaded on the stability side can tip over without any structural failure at all, which is why ground conditions and outrigger set-up matter as much as the chart.
Common Load Chart Mistakes
- ✓Reading the full-outrigger chart when the outriggers can only be partly extended on site
- ✓Forgetting the hook block, rigging or a stowed jib in the total load
- ✓Using the pick-up radius when the set-down radius is larger
- ✓Rounding the radius down to the next row, or interpolating between rows
- ✓Ignoring the wind speed limit stated for the configuration
- ✓Using a chart from a brochure rather than the chart for the crane that will actually arrive
Charts and the Crane's Safety System
Modern cranes carry a rated capacity indicator, often called an LMI, that compares the load on the hook with the chart for the configuration the operator has entered. It is a vital backstop, but only as good as the configuration entered and the ground under the outriggers. Planning still starts with the chart on paper.
Before we quote a crane, we confirm the figure from the exact crane's load chart, and the load chart comes with the machine. See our mobile crane fleet, or read what size crane you need if you are still at the sizing stage.
Frequently Asked Questions
Do I include the hook block in the load weight?+
Yes, unless the chart's notes say otherwise. The hook block, slings, shackles, spreader beams and any stowed jib all count against capacity, and the notes on each chart list the deductions for that crane.
What if my radius falls between two rows on the chart?+
Read the row for the next larger radius. Interpolating between rows or rounding down can overstate the crane's capacity, and on the stability side of the chart that can tip the crane.
Can I use a load chart from the manufacturer's brochure?+
Only for rough early sizing. The lift plan must use the chart for the specific crane and configuration that will be on site, because counterweight, boom options and outrigger settings vary between machines of the same model.
Related Pages
Need Equipment for Your Next Project?
Send the job details for a fast quote on forklifts, mobile cranes, telehandlers, or man lifts anywhere in the UAE. Prefer WhatsApp? Message us here.